
Naturalization Statistics for Fiscal Year 2022
USCIS released naturalization statistics for fiscal year 2022: 968,000 people became U.S. citizens, a 20% increase from the previous fiscal year and the highest since FY2008. The article lists top source countries, states of residence, immigration categories, median age, median years from green card to naturalization, and civics test pass rates.
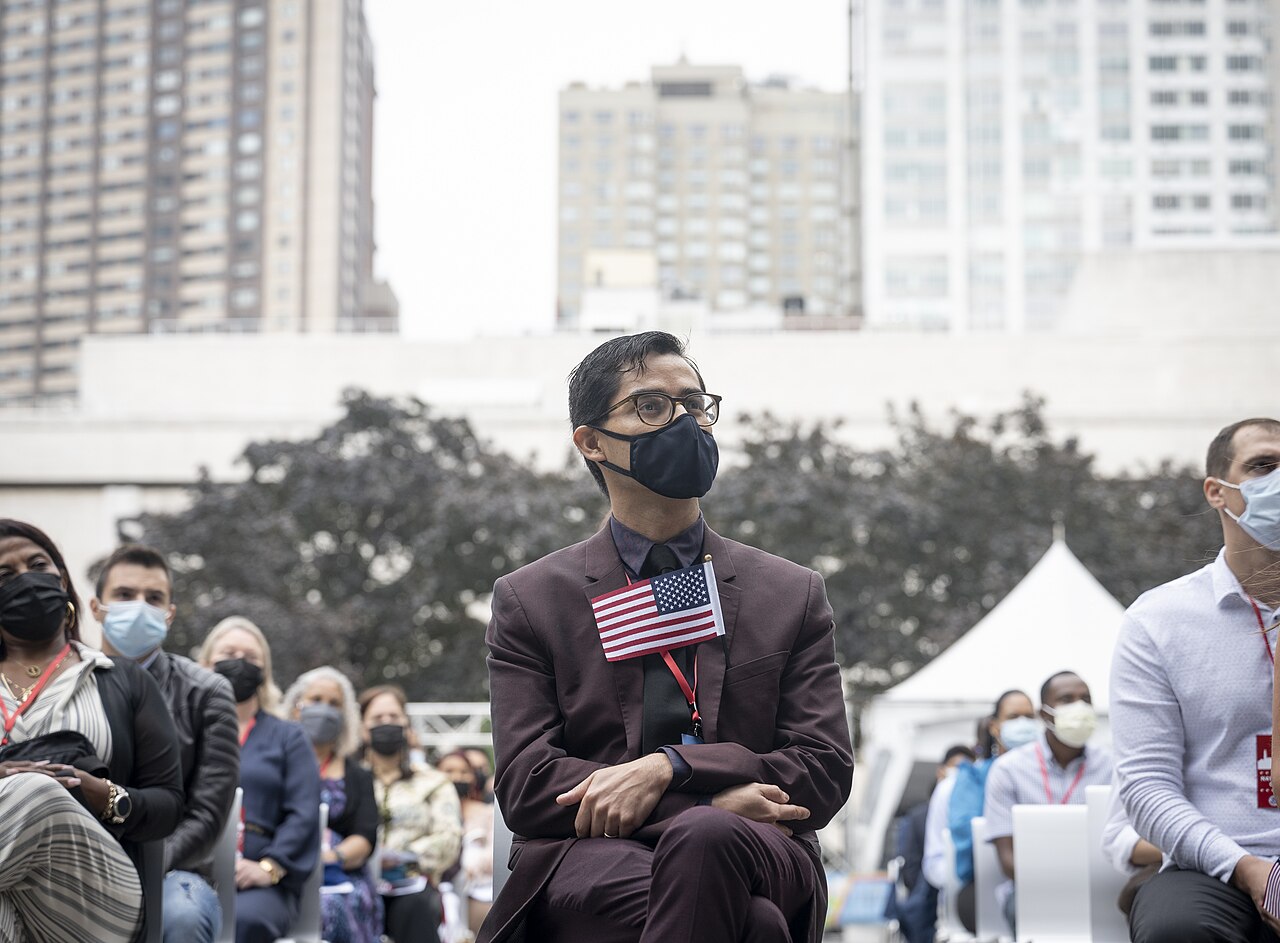
USCIS recently released a set of statistics on naturalizations and new U.S. citizens in FY2022. According to the data, 968,000 people became citizens in fiscal year 2022, a 20% increase over the previous fiscal year and the highest level since fiscal year 2008.
Country of Origin
Fiscal Year 2022 Naturalization Statistics: By Country of Origin
| Country of Origin | Number Naturalized | Percentage (%) |
|---|---|---|
| Mexico | 128,300 | 13.27% |
| India | 65,800 | 6.80% |
| Philippines | 53,300 | 5.51% |
| Cuba | 46,700 | 4.82% |
| Dominican Republic | 34,400 | 3.56% |
| China | 32,700 | 3.38% |
| Vietnam | 23,200 | 2.40% |
| Jamaica | 22,800 | 2.36% |
| El Salvador | 21,300 | 2.20% |
| Colombia | 18,000 | 1.86% |
| Other | 521,100 | 53.85% |
| Total | 967,500 | 100% |
State of Residence
Fiscal Year 2022 Naturalization Statistics: By State of Residence
| State of Residence | Number Naturalized | Percentage (%) |
|---|---|---|
| California | 184,700 | 19.10% |
| Texas | 108,300 | 11.20% |
| Florida | 106,000 | 10.96% |
| New York | 102,300 | 10.58% |
| New Jersey | 53,700 | 5.55% |
| Illinois | 32,800 | 3.39% |
| Washington | 32,100 | 3.32% |
| Georgia | 28,400 | 2.94% |
| Virginia | 27,600 | 2.85% |
| Pennsylvania | 27,000 | 2.79% |
| Other | 264,500 | 27.34% |
| Total | 967,500 | 100% |
Immigration Category
Fiscal Year 2022 Naturalization Statistics: By Immigration Category
| Immigration Category | Number Naturalized | Percentage (%) |
|---|---|---|
| Immediate Relatives of U.S. Citizens | 351,200 | 36.29% |
| – Spouses | 248,300 | 25.68% |
| – Parents | 58,400 | 6.04% |
| – Children | 44,500 | 4.60% |
| Family-Based Preference | 197,900 | 20.47% |
| Refugees and Asylees | 137,100 | 14.18% |
| – Refugees | 103,000 | 10.65% |
| – Asylees | 34,000 | 3.52% |
| Employment-Based | 128,000 | 13.24% |
| Diversity Visa | 48,400 | 5.00% |
| Other/Unknown | 104,900 | 10.84% |
| Total | 967,500 | 100% |
Age | Median Age 41
Years from Green Card to Naturalization
From receiving a green card to naturalization, Mexican immigrants had the longest median time at 12.5 years. Chinese immigrants took 7.2 years, and Indian immigrants took 6.4 years. Note that spouses of U.S. citizens become eligible to apply for naturalization after 3 years of holding a green card, while other immigrants must wait 5 years to be eligible to apply.
Civics Test Pass Rate
The pass rate on the first attempt was 88.4%; including the second attempt, the overall pass rate was 94.8%. For the latest civics test questions, see this article.